-
5. 판다스를 활용한 로그변환Data & ML & AI/Pandas & Scikit-Learn 2022. 5. 30. 21:24반응형
지난 포스트에서는 IQR을 기준으로 이상치를 제거했지만, 250개 데이터 중 173개의 데이터만 살아남는 안타까운 모습을 보였습니다.
단 2개의 칼럼에 대해서만 이상치 제거를 진행했을 뿐인데 말이죠.
scale의 문제가 발생한겁니다.그래서 이번에는 무작정 제거하는 것이 아닌, 데이터의 분포를 변형시켜 scale의 문제를 해결해 이상치 문제를 해결해보도록 하겠습니다.
1. 히스토그램 확인하기
# matplotlib
import matplotlib as mpl
import matplotlib.pyplot as plt
import matplotlib.font_manager as fm

plt.rcParams['axes.unicode_minus'] = False  # matplotlib 마이너스기호 표시
plt.rc('font', family='NanumGothic')  # matplotlib 한글폰트 표시

# pandas
import pandas as pd

# data
df = pd.read_csv('stock_market.csv')

# draw histogram graph
df.hist(bins=20, figsize=(10,10))
거의 대다수의 값들이 좌측에 몰려있음을 알 수 있습니다.
그나마 Debt_continuous(부채가 연속으로 늘어난 분기 수)는 데이터 범위가 0~5로 그 범위가 매우 좁으니 큰 상관은 없겠지만,
Open(시가), High(고가), Volume(거래량)등은 이상치라 하더라도 매우 중요한 데이터일텐데, 이 상태 그대로 IQR을 사용하여 이상치를 제거하면 그대로 삭제될 위험성이 있습니다.데이터 분포가 좌측에 몰려 있는 경우, 분포를 좀 더 정규분포의 형태로 바꿔주는 가장 간단한 방법은 각 데이터에 로그(log)를 취하는 log변환을 활용하는 방법입니다.
2. 로그변환
1) 원본데이터에 바로 log 취하기
# 데이터 타입이 수치형인 칼럼만 채택
col = [c for c in df.columns if df[c].dtype != 'object']
num_df = df[col]
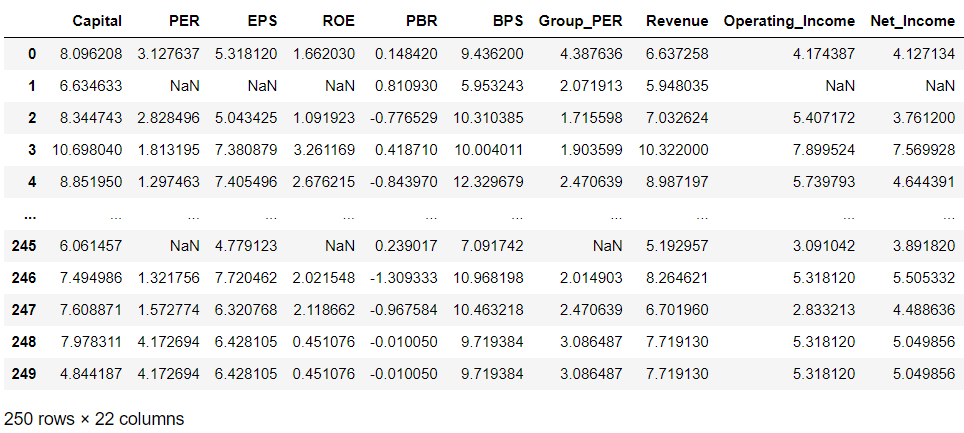
num_df
import numpy as np
log_df = np.log(num_df)
log_df
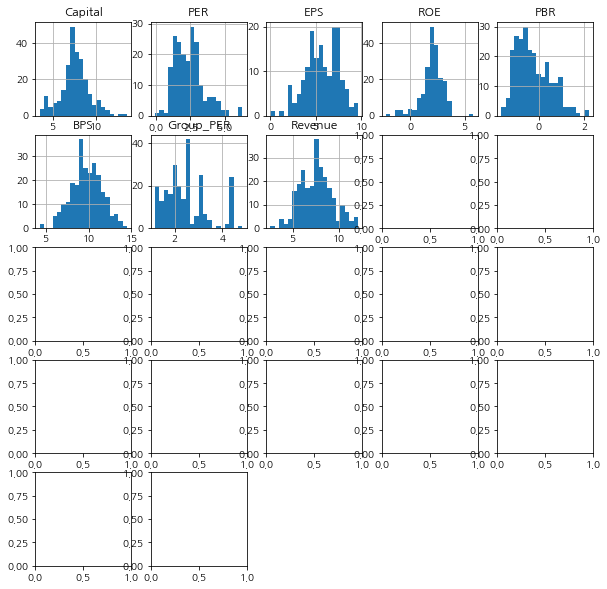
log를 취했으니 잘 변환되었는지 확인하기 위해 히스토그램을 그려보겠습니다.
log_df.hist(bins=20, figsize=(10,10))에러가 발생합니다.
더보기--------------------------------------------------------------------------- ValueError Traceback (most recent call last) <ipython-input-50-a717b31bd0a5> in <module> ----> 1 log_df.hist(bins=20, figsize=(10,10)) ~\AppData\Roaming\Python\Python38\site-packages\pandas\plotting\_core.py in hist_frame(data, column, by, grid, xlabelsize, xrot, ylabelsize, yrot, ax, sharex, sharey, figsize, layout, bins, backend, legend, **kwargs) 209 """ 210 plot_backend = _get_plot_backend(backend) --> 211 return plot_backend.hist_frame( 212 data, 213 column=column, ~\AppData\Roaming\Python\Python38\site-packages\pandas\plotting\_matplotlib\hist.py in hist_frame(data, column, by, grid, xlabelsize, xrot, ylabelsize, yrot, ax, sharex, sharey, figsize, layout, bins, legend, **kwds) 446 if legend and can_set_label: 447 kwds["label"] = col --> 448 ax.hist(data[col].dropna().values, bins=bins, **kwds) 449 ax.set_title(col) 450 ax.grid(grid) ~\anaconda3\lib\site-packages\matplotlib\__init__.py in inner(ax, data, *args, **kwargs) 1563 def inner(ax, *args, data=None, **kwargs): 1564 if data is None: -> 1565 return func(ax, *map(sanitize_sequence, args), **kwargs) 1566 1567 bound = new_sig.bind(ax, *args, **kwargs) ~\anaconda3\lib\site-packages\matplotlib\axes\_axes.py in hist(self, x, bins, range, density, weights, cumulative, bottom, histtype, align, orientation, rwidth, log, color, label, stacked, **kwargs) 6658 # this will automatically overwrite bins, 6659 # so that each histogram uses the same bins -> 6660 m, bins = np.histogram(x[i], bins, weights=w[i], **hist_kwargs) 6661 tops.append(m) 6662 tops = np.array(tops, float) # causes problems later if it's an int <__array_function__ internals> in histogram(*args, **kwargs) ~\anaconda3\lib\site-packages\numpy\lib\histograms.py in histogram(a, bins, range, normed, weights, density) 791 a, weights = _ravel_and_check_weights(a, weights) 792 --> 793 bin_edges, uniform_bins = _get_bin_edges(a, bins, range, weights) 794 795 # Histogram is an integer or a float array depending on the weights. ~\anaconda3\lib\site-packages\numpy\lib\histograms.py in _get_bin_edges(a, bins, range, weights) 424 raise ValueError('`bins` must be positive, when an integer') 425 --> 426 first_edge, last_edge = _get_outer_edges(a, range) 427 428 elif np.ndim(bins) == 1: ~\anaconda3\lib\site-packages\numpy\lib\histograms.py in _get_outer_edges(a, range) 313 'max must be larger than min in range parameter.') 314 if not (np.isfinite(first_edge) and np.isfinite(last_edge)): --> 315 raise ValueError( 316 "supplied range of [{}, {}] is not finite".format(first_edge, last_edge)) 317 elif a.size == 0: ValueError: supplied range of [-inf, 10.650057009592066] is not finite
그림이 잘 그려지다가 Operating_Income을 그릴 타이밍에서 에러가 발생합니다. 이는 로그변환의 한계 때문입니다.
2) 로그변환의 한계1 : 원본데이터 0에 log를 취하면 -inf가 된다.
log_df.describe()
log(0)값은 음수로 발산하기 때문에 -inf입니다.
이러면 히스토그램의 x축을 정할 수 없기 때문에 그래프를 그릴 수가 없습니다. 물론 그래프를 못그려서 문제인게 아니라 그 값을 어떻게 활용할 수도 없다는게 근본적인 문제가 발생합니다.원본데이터가 정확한 0이 아니더라도, 0에 가까우면 가까울수록 log를 취한 값은 기하급수적으로 큰 음수값이 되기 때문에, 오히려 분포를 망치게 될 수 있습니다.
3) 로그변환의 한계2 : 원본데이터가 음수일 경우 log를 취할 수가 없다.
음수에 log를 취할 수 없기 때문에, np.log(df)를 하면 음수였던 값들은 결측값이 되어버립니다.
print("원본 데이터에서의 결측치 존재 칼럼 :",df.columns[df.isnull().any()], '\n')
print("log변환 데이터에서의 결측치 존재 칼럼 :",log_df.columns[log_df.isnull().any()], '\n')

log_df.info()
원본 데이터에서의 결측치 존재 칼럼 : Index(['PER', 'ROE', 'Dividend'], dtype='object') log변환 데이터에서의 결측치 존재 칼럼 : Index(['PER', 'EPS', 'ROE', 'PBR', 'BPS', 'Group_PER', 'Operating_Income', 'Net_Income', 'Dividend', 'Debt', 'Retention'], dtype='object') <class 'pandas.core.frame.DataFrame'> RangeIndex: 250 entries, 0 to 249 Data columns (total 22 columns): # Column Non-Null Count Dtype --- ------ -------------- ----- 0 Capital 250 non-null float64 1 PER 200 non-null float64 2 EPS 163 non-null float64 3 ROE 201 non-null float64 4 PBR 249 non-null float64 5 BPS 249 non-null float64 6 Group_PER 245 non-null float64 7 Revenue 250 non-null float64 8 Operating_Income 191 non-null float64 9 Net_Income 160 non-null float64 10 Dividend 189 non-null float64 11 Debt 249 non-null float64 12 Debt_continuous 250 non-null float64 13 Retention 242 non-null float64 14 Retention_Continuous 250 non-null float64 15 Open 250 non-null float64 16 High 250 non-null float64 17 Low 250 non-null float64 18 Close 250 non-null float64 19 DaytoDay 250 non-null float64 20 Volume 250 non-null float64 21 Highest_Price 250 non-null float64 dtypes: float64(22) memory usage: 43.1 KB결측치의 개수도 늘었고, 결측치가 존재하는 칼럼의 개수 또한 증가했습니다.
이처럼, 무작정 log변환을 적용하면 문제가 발생합니다.4) 로그변환의 단점, 한계를 보완하는 방법
분야마다, 해결하고자하는 문제마다 보완하는 방법은 매우 많습니다. 로그변환을 사용하지 않는게 더 나은 경우가 훨씬 많습니다.
하지만 분포가 과다하게 좌측에 몰려있는 경우 이를 해결하는 가장 간편한 방법이 로그변환이기 때문에,이를 포기하고 싶지 않은 욕망이 생기는 것도 사실입니다.
그나마의 해결 방법은 무엇이 있을까요?i. 로그변환을 사용해도 문제가 없는 칼럼에만 적용한다
이게 가장 근본적이죠. 문제가 없는 경우에만 적용하는게 최선입니다.
ii. 문제가 될만한 음수, 0, 0에 수렴하는 양수 값등을 다른 값으로 대체한다.
머신러닝이나 기타 모델생성, 문제해결을 위해 종종 활용하는 방식입니다. 0을 일괄 0.001이나 기타 값으로 변환하는거죠.
log(0.001)= -6.9...이기 때문에 -inf보다는 낫습니다. 하지만 이렇게 대체해도 괜찮은지 해당 분야에서의 전문적인 지식이 당연히 필요합니다.이외에도 다른 정규화 방식을 활용한 뒤에 로그변환을 사용하는 방식 등, 다양한 방법이 있겠지만, 그럴거라면 그냥 그 방식만 사용하는 것이 더 좋을 수 있습니다.
5) 마무리
단점이야 있지만, 로그변환은 여전히 강력한 scale 문제 해결 방법입니다.
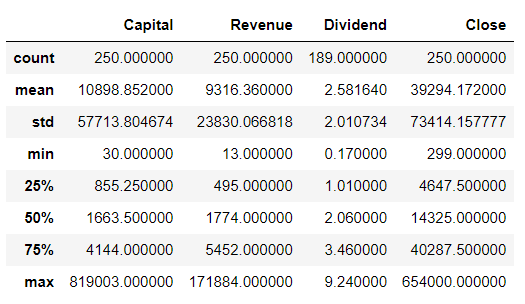
미리 데이터를 살펴보고, 문제가 없을 것으로 판단되는 칼럼에 대해서만 로그변환을 사용하면 매우 활용도 높은 데이터를 얻을 수 있습니다.df[['Capital','Revenue', 'Dividend','Close']].describe()
df[['Capital','Revenue', 'Dividend','Close']].hist(bins=20)
로그변환 전 분포 log_df[['Capital','Revenue', 'Dividend','Close']].hist(bins=20)
로그변환 후 분포 반응형'Data & ML & AI > Pandas & Scikit-Learn' 카테고리의 다른 글
7. scikit-learn을 활용한 간단한 회귀모델(regression with LinearRegression) (1) 2022.06.08 6. scikit-learn을 활용한 간단한 분류모델 (classification with LogisticRegression) (0) 2022.06.03 4. 판다스를 활용한 이상치 처리(boxplot, IQR) (0) 2022.05.29 3. 판다스를 활용한 Null값 대체(특정값, 평균, 특정함수) (0) 2022.05.24 2. 판다스를 활용한 Null값 제거 (결측행, 결측열 제거) (0) 2022.05.23